


The Health Protection Surveillance Centre has updated a map which shows, by electoral district, the prevalence of Covid-19 in Laois.
This maps shows that total number of infections that have been recorded since the start of the outbreak in March – so the vast majority of the cases will no longer be active.
The first of these type of maps was produced on June 12 and it has now been updated as far as August 12 – allowing us to compare figures between the two dates.
Between June 12 and July 19, Laois recorded just two new infections as the total number of cases increased from 264 to 266.

However, since then, Laois have added almost 100 new infections to their total and the figures from August 12 show that there were 345 cases in the county at that time, an increase of 81. As of August 15, there are 358.
And this map provides further insight into where those cases are occurring by electoral district.

In order to protect patient confidentiality, the HSPC does not give exact figures for areas that have less than five cases.
Unsurprisingly, the biggest towns in Laois have recorded the highest number of cases and a lot of areas have recorded an increase in cases since June 12.

Most notably is Emo which went from less than five cases two months ago to 27 now. With a population of only 1,252, this gives an incidence rate of 2,156 per 100,000 people.
LaoisToday has previously reported on confirmed cases being detected at the Direct Provision Centre nearby in the Montague Hotel and presumably these cases account for much of the rise.
Elsewhere, Portlaoise is broken into three districts and they all have recorded cases.
Portlaoise Rural has 81 (an incidence of 502 per 100,000 people), Portlaoise Urban has 10 (257 per 100,000) while Clondarrig has 15 (801 per 100,000).
This is an increase on the June 12 figures which showed Portlaoise Urban had 8, Portlaoise Rural 67 and Clondarrig had 13.
Borris, an area between Portlaoise and Mountmellick, previously had six cases on June 12 but now has nine (533 per 100,000 people).
Portarlington North ED has 23 (956 per 100,000 people) while Portarlington South has 28 (392 per 100,000).
This is an increase from June 12 where there were 14 in Portarlington North and 21 in Portarlington South.
Between Mountmellick Urban and Rural, there are now 19 cases, (634 per 100,000), an increase of one from June 12.
Abbeyleix have now had seven cases for an incidence rate of 251 per 100,000 – an increase of two cases in the last two months.
Of the smaller towns, Ballybrittas has shown an increase from seven to 10 cases and now has an incidence rate of 779 per 100,000.
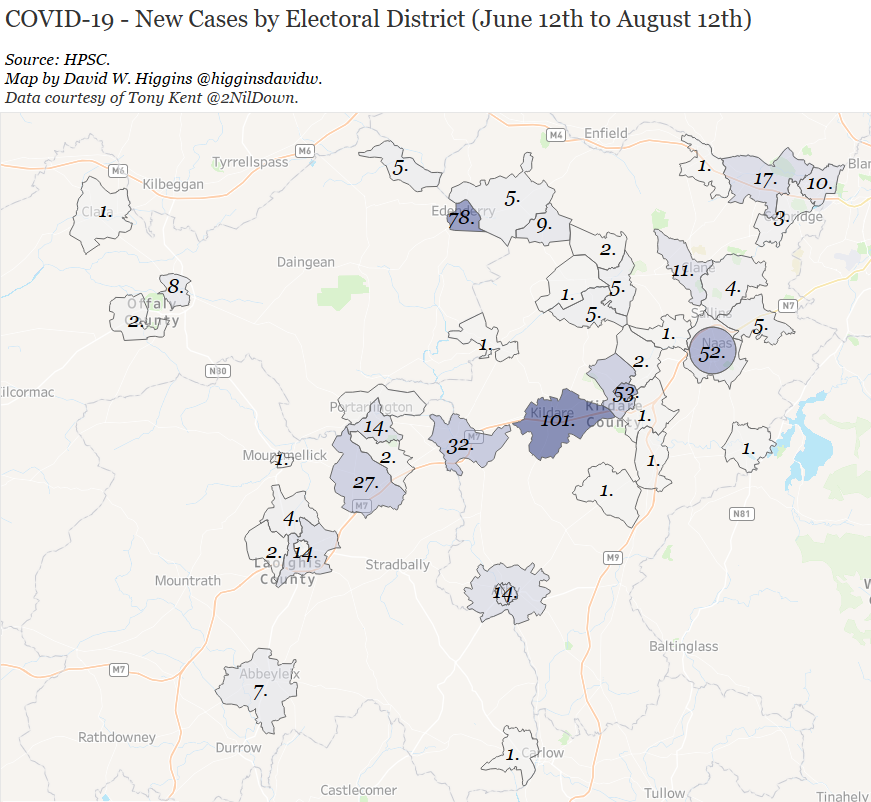
Down the Carlow end of the county, figures have remained relatively stable with Graiguecullen adding just one new case to go to eight (167 per 100,000).
But towns and villages like Abbeyleix (7), Stradbally (10), Durrow, Ballacolla, Cullohill, Ballyroan, Ballinakill and Rosenallis (all less than five) have recorded no new infections in the last two months.
To see figures on where you live, click here and then enter your eircode to search.
SEE ALSO – #LoveLaois: Support local and help ensure the survival of Laois businesses


